
Page 139 - Maths Class 06
P. 139
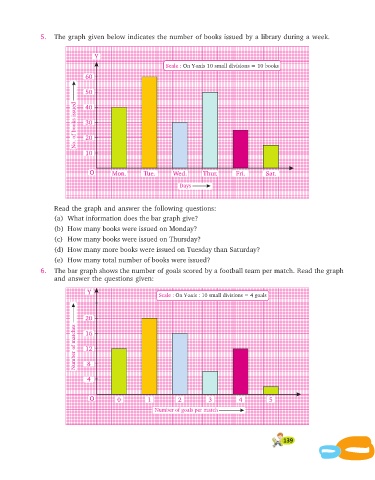
5.   The graph given below    indicates the  number of books   issued by a  library during a week.


                                  Y
                                                          Scale : On Y-axis 10 small divisions = 10 books
                               60

                               50

                           No. of books issued  30
                               40


                               20

                               10


                                O       Mon.       Tue.      Wed.      Thur.       Fri.      Sat.

                                                               Days


                    Read the graph and answer the following questions:
                    (a) What information does the bar graph give?

                    (b) How many books were issued on Monday?
                    (c) How many books were issued on Thursday?
                    (d) How many more books were issued on Tuesday than Saturday?
                    (e) How many total number of books were issued?

               6.   The bar graph shows the number of goals scored by a foot ball team per match. Read the graph
                    and answer the questions given:

                               Y
                                                        Scale : On Y-axis : 10 small divisions = 4 goals


                               20
                           Number of matches  16


                               12

                               8

                               4


                                O         0         1          2         3          4         5

                                                       Number of goals per match


                                                                                                   139