
Page 137 - Maths Class 06
P. 137
(a) What is the information given by the bar graph?
(b) How many cars were sold in June?
(c) How many more cars were sold in January than February?
(d) How many total cars were sold in first half of the year?
SOLUTION : (a) The given bar graph rep re sents the num ber of cars were sold in the first half of the
year.
(b) 100 cars (c) 500 - 350 = 150 cars (d) 2600 cars.
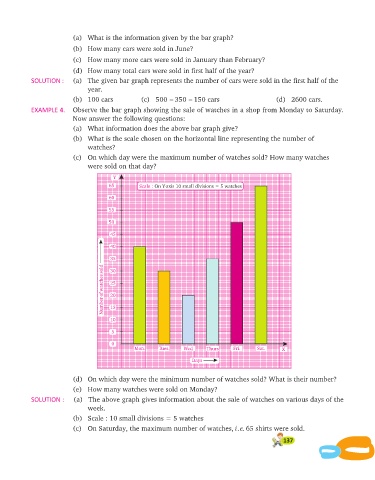
EXAM PLE 4. Observe the bar graph show ing the sale of watches in a shop from Monday to Satur day.
Now answer the follow ing ques tions:
(a) What information does the above bar graph give?
(b) What is the scale chosen on the horizontal line representing the number of
watches?
(c) On which day were the maximum number of watches sold? How many watches
were sold on that day?
Y
65 Scale : On Y-axis 10 small divisions = 5 watches
60
55
50
45
40
35
Number of watches sold 25
30
20
15
10
5
0
Mon. Tues. Wed Thurs Fri. Sat. X
Days
(d) On which day were the minimum number of watches sold? What is their number?
(e) How many watches were sold on Monday?
SOLUTION : (a) The above graph gives in for ma tion about the sale of watches on var i ous days of the
week.
(b) Scale : 10 small divisions = 5 watches
(c) On Saturday, the maximum number of watches, i e. . 65 shirts were sold.
137