Page 136 - Maths Class 06
P. 136

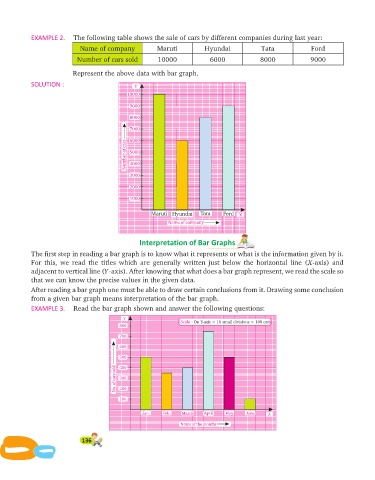
EXAMPLE 2.    The following table shows the sale of cars by different companies during last year:
                             Name of company           Maruti           Hyundai            Tata              Ford
                            Number of cars sold         10000             6000             8000             9000

                          Represent the above data with bar graph.

            SOLUTION :                          Y
                                             10000
                                              9000

                                              8000
                                              7000

                                              6000
                                            Number of cars  5000


                                              4000
                                              3000

                                              2000
                                              1000


                                                     Maruti  Hyundai  Tata    Ford  X
                                                           Name of company


                                                 Interpretation of Bar Graphs
            The first step in reading a bar graph is to know what it represents or what is the information given by it.
            For this, we read the titles which are    generally written just below the hor   izontal line (X-axis) and
            ad ja cent to ver ti cal line (Y-axis). Af ter know ing that what does a bar graph rep re sent, we read the scale so
            that we can know the pre cise val ues in the given data.
            After reading a bar graph one must be able to draw certain conclusions from it. Drawing some conclusion
            from a given bar graph means interpretation of the bar graph.
            EX AM PLE 3.  Read the bar graph shown and an swer the fol low ing ques tions:
                                            Y
                                                               Scale : On Y-axis = 10 small divisions = 100 cars
                                          800
                                          700
                                          600

                                          500
                                         No. of cars sold  300
                                          400

                                          200

                                          100

                                                  Jan.   Feb.   March   April  May    June    X
                                                               Name of the months

                             136
   131   132   133   134   135   136   137   138   139   140   141