
Page 134 - Maths Class 06
P. 134
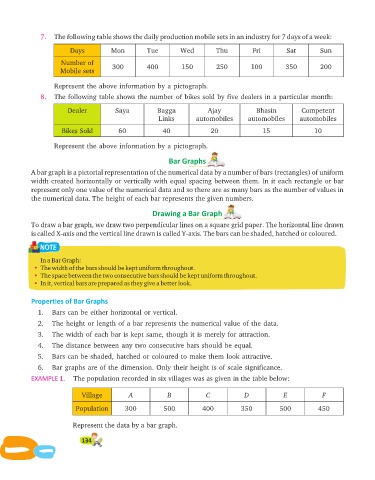
7.   The follow ing table shows the daily produc tion mobile sets in an indus try for 7 days of a week:

                         Days          Mon          Tue        Wed          Thu         Fri         Sat         Sun

                      Number of
                      Mobile sets       300         400         150         250         100         350         200

                    Represent the above   information by a pictograph.
               8.   The following table shows the number of bikes sold by five dealers in a       particular  month:

                        Dealer           Saya          Bagga             Ajay             Bhasin         Competent
                                                        Links        automobiles       automobiles       automobiles

                      Bikes Sold          60             40               20                15                10

                    Represent the above   information by a pictograph.

                                                           Bar Graphs
            A bar graph is a pictorial representation of the numerical data by a number of bars (rectangles) of uniform
            width created horizontally   or vertically with equal spacing between them. In it each rectangle     or bar
            represent only one value of the numerical data and so there are as many bars as the number of values in
            the numerical data. The height of each bar represents the given numbers.

                                                      Drawing a Bar Graph

            To draw a bar graph, we draw two perpendicular lines on a square grid paper. The horizontal line drawn
            is called X-axis and the vertical line drawn is called Y-axis. The bars can be shaded, hatched or coloured.

               NOTE

               In a Bar Graph:
               The width of the bars should be kept uniform throughout.
               The space between the two consecutive bars should be kept uniform throughout.
               In it, vertical bars are prepared as they give a better look.


            Properties of Bar Graphs

              1.   Bars can be either horizontal or   vertical.
              2.   The height or  length of a bar represents the numerical value of the     data.

              3.   The width of each bar is kept same, though it is merely for attraction.
              4.   The distance between any two consecutive bars should be equal.
              5.   Bars can be shaded, hatched or coloured to make them look         attractive.

              6.   Bar graphs are of the dimension. Only their height is of scale significance.
            EX AM PLE 1.  The pop u la tion re corded in six vil lages was as given in the ta ble be low:

                             Village          A            B            C            D             E            F


                           Population       300           500          400          350           500          450

                          Represent the data by a bar graph.

                             134