Page 129 - Maths Class 06
P. 129

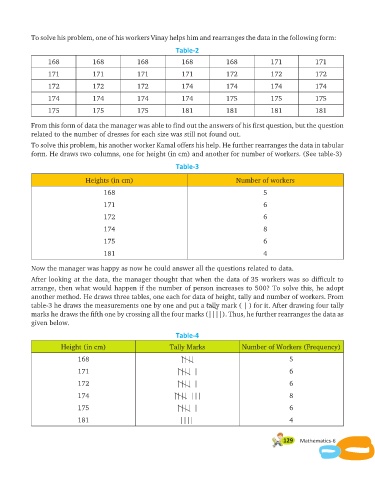
To solve his problem, one of his workers Vinay helps him and rearranges the data in the following form:
                                                              Table-2

                  168            168            168             168            168             171            171
                  171            171            171             171            172             172            172

                  172            172            172             174            174             174            174

                  174            174            174             174            175             175            175
                  175            175            175             181            181             181            181

            From this form of data the manager was able to find out the answers of his first question, but the question
            related to the number of dresses for each size was still not found out.

            To solve this problem, his another worker Kamal offers his help. He further rearranges the data in tabular
            form. He draws two columns, one for height (in cm) and another for number of workers. (See table-3)

                                                              Table-3

                               Heights (in cm)                                     Number of workers

                                     168                                                    5

                                     171                                                    6
                                     172                                                    6

                                     174                                                    8
                                     175                                                    6

                                     181                                                    4

            Now the manager was happy as now he could answer all the questions related to data.

            After looking at the data, the manager thought that when the data of        35 workers   was so difficult to
            arrange, then what would happen if the number of person increases to 500? To solve this,          he adopt
            another method. He draws three tables, one each for data of height, tally and number of workers. From
            table-3 he draws the measurements one by one and put a tally mark ( | ) for it. After drawing four tally
            marks he draws the fifth one by crossing all the four marks (||||). Thus, he further rearranges the data as
            given below.

                                                              Table-4
                      Height (in cm)                        Tally Marks              Number of Workers (Frequency)

                            168                                ||||                                  5
                            171                               |||| |                                 6

                            172                               |||| |                                 6

                            174                              |||| |||                                8
                            175                               |||| |                                 6

                            181                                ||||                                  4


                                                                                                   129   Mathematics-6
   124   125   126   127   128   129   130   131   132   133   134