
Page 130 - Maths Class 06
P. 130
The introduction of tally marks make it easier for the manager to count the workers of respective height.
Pictographic Presentation
Sometimes, it can be difficult to draw any conclusions from a large amount of data. To overcome this
difficulty, we can represent the data in the form of graph, through which we can get the answers of the
questions easily and quickly. In this class, we shall learn two types of graphs:
(a) Pictographs and (b) Bar graphs.
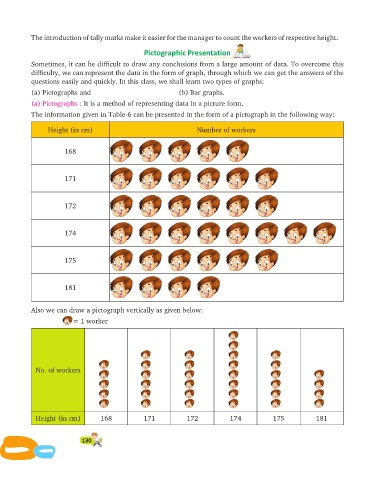
(a) Pictographs : It is a method of representing data in a picture form.
The information given in Table-6 can be presented in the form of a pictograph in the following way:
Height (in cm) Number of workers
168
171
172
174
175
181
Also we can draw a pictograph vertically as given below:
= 1 worker
No. of workers
Height (in cm) 168 171 172 174 175 181
130