Page 135 - Maths Class 06
P. 135

SOLUTION :    Step 1 : Draw ing the axis
                          We take a graph paper. We mark a point O towards the left hand lower corner and draw
                          two rays OX and OY perpendicular to each other. OX is called the horizontal ray and OY is
                          called the vertical ray
                          Step 2 : La bel ling the axis
                          We shall represent numerical data i e. ., population along the vertical ray OY and the villages
                          along the horizontal ray OX.

                          Step 3 : Choos ing a scale
                          We choose the scale in such a way that the bar of highest value fits easily on the graph paper
                          and the bar of the lowest value can be seen easily.
                          Here, the highest value is 500, and the lowest value is 300. We, therefore, choose a scale in
                          which 1 cm length OY represents 100 people.

                          Step 4 : Cal cu lat ing the lengths of bars
                                             æ 1         ö
                                                         ÷
                                         A = ç     ´300 cm    = 3 cm
                                             è 100       ø
                                             æ 1         ö
                                         B = ç    ´500 cm     = 5 cm
                                                         ÷
                                             è 100       ø
                                             æ 1         ö
                                        C = ç     ´ 400 cm    = 4 cm
                                                         ÷
                                             è 100       ø
                                             æ 1         ö
                                                         ÷
                                         D = ç     ´350 cm    = 3.5  cm
                                             è 100       ø
                                             æ 1         ö
                                         E = ç    ´500 cm     = 5 cm
                                                         ÷
                                             è 100       ø
                                             æ 1         ö
                                         F = ç    ´ 450 cm    = 4.5  cm
                                                         ÷
                                             è 100       ø
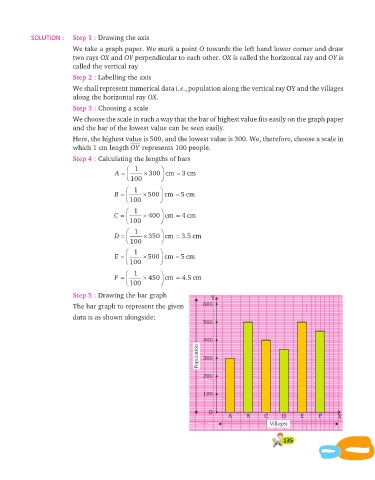
                          Step 5 : Draw ing the bar graph                 Y
                          The bar graph to represent the given         600

                          data is as shown alongside:
                                                                       500


                                                                       400
                                                                     Population  300


                                                                       200


                                                                       100


                                                                         O
                                                                                A     B     C     D      E     F      X
                                                                                              Villages

                                                                                                   135
   130   131   132   133   134   135   136   137   138   139   140