Page 138 - Maths Class 06
P. 138

(d) On Wednesday, minimum number of watches were sold. The sale on that day was 20.
                          (e) 40 watches were sold on Monday.


                      Exercise 9.2


               1.   The number of students admitted in a year in a school in different classes is given below.
                    Represent  the data by a bar graph.

                          Class            VI         VII        VIII         IX          X          XI         XII
                     No. of Students      82          36          40         28          20          55         20


               2.   The marks obtained by a student in various subjects      are given below:

                          Subject           English          Hindi          Maths           Science       S. Studies
                     Marks obtained           70              75              80              95              60

                    Draw a bar graph to    represent  the given  data.

               3.   The year-wise  growth of a   little  stars school is shown below:

                             Year           2012-13      2013-14      2014-15      2015-16      2016-17      2017-18
                     Number of students        110          170          185         245          360          540

                    Draw a bar graph to    represent  the above data.

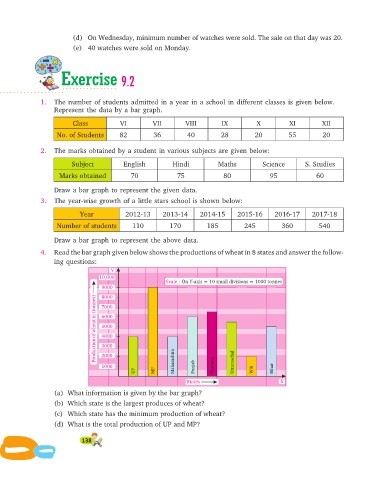
               4.   Read the bar graph given below shows the produc tions of wheat in 8 states and answer the follow -
                    ing questions:
                                       Y
                                   10,000
                                                          Scale : On Y-axis = 10 small divisions = 1000 tonnes
                                    9000
                                  Production of wheat in (tonnes)  3000
                                    8000
                                    7000
                                    6000
                                    5000
                                    4000


                                    2000
                                    1000                     Maharashtra  Punjab  Haryana  Uttaranchal  Bihar
                                                UP    MP                                W B

                                                                  States                          X
                    (a) What information is given by the bar graph?
                    (b) Which state is the largest produces of wheat?

                    (c) Which state has the minimum production of wheat?
                    (d) What is the total production of UP and MP?

                             138
   133   134   135   136   137   138   139   140   141   142   143