
Page 140 - Maths Class 06
P. 140
(a) How many matches were played in all?
(b) In how many matches 4 golas were scored?
(c) In how many matches no goal was scored?
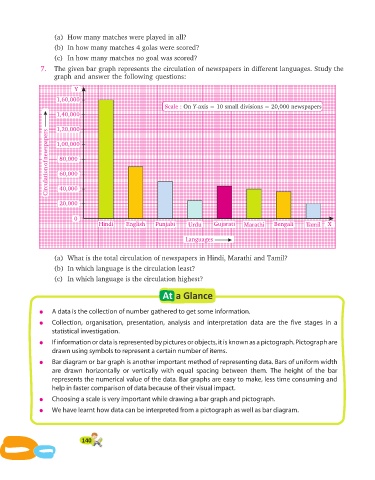
7. The given bar graph repre sents the circu la tion of news pa pers in differ ent languages. Study the
graph and answer the following questions:
Y
1,60,000
Scale : On Y-axis = 10 small divisions = 20,000 newspapers
1,40,000
1,20,000
Circulation of newspapers 80,000
1,00,000
60,000
40,000
20,000
0
Hindi English Punjabi Urdu Gujarati Marathi Bengali Tamil X
Languages
(a) What is the total circulation of newspapers in Hindi, Marathi and Tamil?
(b) In which language is the circulation least?
(c) In which language is the circulation highest?
At a Glance
l A data is the collection of number gathered to get some information.
l Collection, organisation, presentation, analysis and interpretation data are the five stages in a
statistical investigation.
l If information or data is represented by pictures or objects, it is known as a pictograph. Pictograph are
drawn using symbols to represent a certain number of items.
l Bar diagram or bar graph is another important method of representing data. Bars of uniform width
are drawn horizontally or vertically with equal spacing between them. The height of the bar
represents the numerical value of the data. Bar graphs are easy to make, less time consuming and
help in faster comparison of data because of their visual impact.
l Choosing a scale is very important while drawing a bar graph and pictograph.
l We have learnt how data can be interpreted from a pictograph as well as bar diagram.
140